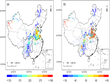
in the major rivers of the Tibetan Plateau(2020-2021)")
This dataset includes the concentration and distribution data of poly- and perfluoroalkyl substances (PFAS) in the Yarlung Tsangpo River and three major rivers in Hengduan Mountain region. The samples were collected in 2020 and 2021 from 83 locations in four major rivers, including the Yarlung Tsangpo, Nu, Lancang and Jinsha Rivers. The water samples were prepared by solid phase extraction, purification, concentration steps, and then determined by HPLC (ThermoFisher Scientific, USA) coupled to a TSQ Quantiva triple quadrupole mass spectrometer. The target compounds included 10 perfluorinated carboxylic acids (PFCAs) and 3 perfluorinated sulfonic acids (PFSAs). Specifically, perfluorobutanoic acid (PFBA), perfluoropentanoic acid (PFPeA), perfluorohexanoic acid (PFHxA), perfluoroheptanoic acid (PFHpA), perfluorooctanoic acid (PFOA),perfluorononanoic acid (PFNA), perfluorodecanoic acid (PFDA), perfluoroundecanoic acid (PFUnDA), perfluorododecanoic acid (PFDoA) and perfluorotridecanoic acid (PFTrA), perfluorobutanesulfonic acid (PFBS), perfluorohexanesulfonic acid (PFHxS), and perfluorooctanesulfonic acid (PFOS). In the process of sample pretreatment, isotope labeled recovery standards were added, and the sample recovery was calculated to be between 53% and 96%. Conventional water quality test parameters include temperature, dissolved oxygen, pH, conductivity, salinity, and dissolved organic carbon. The accuracy of the parameters were 0.1℃, 0.01mg/L, 0.01, 0.1μS/cm, 0.01ppt and 0.01mg/L, respectively. Among them, the dissolved organic carbon was measured by TOC analyzer, and the other water quality parameters were measured by YSI ProPlus portable multi-parameter water quality instrument. This dataset can provide a scientific basis for mapping the spatial distribution of organic pollution over the Tibetan Plateau and assessing the water quality safety of water towers in Asia.
REN Jiao , WANG Xiaoping
")
The annual emission data of conventional air pollutants (PM2.5, SO2, NH3, NOX) under different carbon neutralization technologies and air pollutant end treatment scenario combinations from 2017 to 2060, generated based on the computable general equilibrium model and the base year emission inventory, are used for the policy scenario analysis of the future coordinated treatment of carbon dioxide and air pollution in China. This data has been applied to the evaluation of the health synergy benefits of the carbon neutral technology path, as the data input of the health impact assessment model, to estimate the premature death, incidence rate and the resulting life expectancy loss, and to monetize these health impacts. The health common interests of monetization are compared with the corresponding emission reduction costs to explore the cost-effectiveness of different carbon neutral technology combinations.
WANG Can , ZHANG Shihui
")
Provide the spatial distribution of the annual emissions of BC, CH4, CO2, CO, NH3, NMVOC, NOx, OC and SO2 from agriculture, energy exploitation, industrial and fuel combustion, surface transportation, residential and commercial housing, solvent production, waste disposal and international shipping in China from 1990 to 2015, in kg/m2/yr. The spatial precision is 0.5 °, and the geographic coordinate system is WGS84. The data comes from the CEDs data set. The historical homogenized land use data of China is obtained by linear time interpolation, Chinese regional mask extraction and coordinate system transformation of the original data, and saved in geotiff file format. The methods and standards of data over the years are consistent, the coverage is complete, and the collection and processing process is traceable and reliable.
WANG Can , WANG Jiachen
")
The data includes ecological policy documents after 1979, involving laws, regulations, terms and schemes on Ecological Governance and ecological management at the national and local government levels. The data combed the evolution process of the country in ecological and environmental governance, as well as the environmental strategies established in different development periods. The research group collected various documents of ecological policies on the government's official website and local yearbooks every year from 2018 to 2021. In order to ensure the relative integrity and pertinence of the data, this study sorted and selected the policy texts according to the following principles: ① the main sources of policies are the government's official website and its subordinate departments; ② Documents in line with ecological policies; ③ Select laws and regulations, plans, opinions, methods, detailed rules, regulations, announcements, notices, resolutions and other documents reflecting ecological environment policies. Construct the categories of the policy documents studied, that is, determine the perspective of analyzing the policy text, and define the primary and secondary categories, so that the chief coder and sub coder can understand it uniformly; ② Code the policies one by one after preparing the coding table according to the main category, that is, after carefully reading the policy content, if its content meets the analysis dimension required by the category construction table, fill its code into the coding table; ③ The data of this study is based on the official website and field policy research, which can effectively distinguish the contents of categories involved in the policy text. Therefore, the content analysis of this study has a good level of validity The innovation and evolution of policies change the impact of human activities on the environment to a certain extent, and the guidance and impact of ecological policies on environmentally vulnerable areas are more obvious. If we can fully grasp the dynamic change process of ecological policies and understand the evolution law of ecological policies, we can formulate ecological policies conducive to improving the environment, This paper studies the evolution law of Qilian mountain ecological policy issued since 1979 by using the content analysis method, in order to provide a scientific basis for the formulation of Qilian mountain ecological policy
DING Wenguang , XIE Shuntao

The data set records the operation of the pollution source monitoring center in Haixi Prefecture of Qinghai Province from July 2018 to September 2019. The data is collected from the Department of ecological environment of Haixi Prefecture. The data set contains 42 text files, recording the weekly report of Haixi pollution source monitoring center from July 2018 to September 2019, and each file records the content of the weekly report once. Including the video monitoring system operation, online monitoring system operation, new online monitoring system construction acceptance, online monitoring system construction acceptance, online monitoring data analysis and transmission efficiency. Data coverage time range: July 16, 2018 to September 1, 2019.
Ecological Environment Bureau of Haixi Prefecture Qinghai Province
 grid products of Qinghai Tibet Plateau (1km, 2017)")
The temperature humidity index (THI) was proposed by J.E. Oliver in 1973. Its physical meaning is the temperature after humidity correction. It considers the comprehensive impact of temperature and relative humidity on human comfort. It is an important index to measure regional climate comfort. On the basis of referring to the existing classification standards of physiological and climatic evaluation indexes, combined with the natural and geographical characteristics of the Qinghai Tibet Plateau and facing the needs of human settlements suitability evaluation in the Qinghai Tibet Plateau, the temperature and humidity index and its suitability zoning results of the Qinghai Tibet Plateau (more than 3000 meters) are developed (including unsuitable, critical suitable, general suitable, relatively suitable and highly suitable).
LI Peng, LIN Yumei

The data include raw sequencing result of plant DNA in surface sediments of 33 lakes in the Qinghai-Tibetan Plateau and arid northwestern China. We used PowerMax Soil Kit of Qiagen company in Germany to extract DNA, then used universal plant primer g-h (Taberlet et et al., 2007) to amplify P6 loop of chloroplast trnL (UAA) intron in the sample. The PCR products were then sent to Fasteris company in Switzerland for the next-generation paired-end sequencing. The sequencing instrument is Illumina Nextseq 550. The data quality score (Q30) is 81.97.
LIU Xingqi, JIA Weihan
")
1) Data content: the main ecological environment data retrieved from remote sensing in Pan third polar region, including PM2.5 concentration, forest coverage, Evi, land cover, and CO2; 2) data source and processing method: PM2.5 is from the atmospheric composition analysis group web site at Dalhousie University, and the forest coverage data is from MODIS Vegetation continuum Fields (VCF), CO2 data from ODIAC fossil fuel emission dataset, EVI data from MODIS vehicle index products, and land cover data from ESA CCI land cover. 65 pan third pole countries and regions are extracted, and others are not processed; 3) data quality description: the data time series from 2000 to 2015 is good; 4) data application achievements and prospects: it can be used for the analysis of ecological environment change.
LI Guangdong
")
The data set contains respiratory inflammatory indexes collected from four follow-up visits of native Tibetans in Lhasa and Nyingchi, Tibet Autonomous Region. The project carried out four follow-up surveys in Lhasa and Nyingchi from May to June and September to October 2021, and a total of 212 subjects were recruited. Fractional exhaled nitric oxide (FeNO) is produced by airway cells. Its concentration is highly correlated with the number of inflammatory cells. It is a simple and noninvasive biological index, which can effectively reflect the degree of airway inflammation,. At each visit, about 5 liters of exhaled gas were collected with Teflon air bag, and then the content of nitric oxide (FeNO) in exhaled gas was measured with thermo NOx gas analyzer to characterize the inflammatory level of respiratory system. The data can be used to evaluate the level of respiratory inflammation of native Tibetans in Tibet, and further analyze the effects of ozone exposure and hypoxia on respiratory inflammation of natives.
GONG Jicheng
")
The data set contains the blood routine and blood biochemical indexes collected from native Tibetans in Lhasa and Nyingchi in Tibet Autonomous Region for four follow-up visits. The project carried out four follow-up surveys in Lhasa and Nyingchi from May to June and September to October 2021, and a total of 212 subjects were recruited. Blood is an important circulating element of human body, which stores the information of human health. Biological samples of subjects were collected at each visit. The professional nurses of Lhasa Second People's Hospital and Nyingchi Jianmin hospital collected 18 ~ 20ml blood samples, and some samples were sent to the hospital for blood routine and blood biochemical analysis. The data can be used to evaluate the health level of permanent residents in Tibet and further analyze the impact of ozone exposure and hypoxia on the health of permanent residents.
GONG Jicheng
")
The data set contains the systemic inflammatory oxidative stress indexes collected from native Tibetans in Lhasa and Nyingchi in Tibet Autonomous Region for four follow-up visits. The project carried out four follow-up surveys in Lhasa and Nyingchi from May to June and September to October 2021, and a total of 212 subjects were recruited. Biological samples of subjects were collected at each visit. The professional nurses of Lhasa Second People's Hospital and Nyingchi Jianmin hospital collected 18 ~ 20ml blood samples, and some samples were sent to the hospital for analysis. The related indexes of leukocytes such as lymphocytes, basophils, neutrophils, eosinophils and monocytes can reflect the level of systemic oxidative stress inflammation. The data can be used to evaluate the level of systemic inflammatory oxidative stress of native Tibetans in Tibet, and further analyze the effects of ozone exposure and hypoxia on systemic inflammatory oxidative stress of permanent residents.
GONG Jicheng
")
The data set included lung function and cardiovascular function indexes collected during four follow-up visits to the high altitude natives in Lhasa and Nyingchi, Tibet Autonomous Region. Four follow-up surveys were conducted in Lhasa and Nyingchi from May to June and September to October 2021, and a total of 212 subjects were recruited. During each visit, the forced vital capacity (FVC), forced expiratory volume in one second (FEV1), vital capacity (VC) and other pulmonary function indexes of the subjects were measured by Mir pulmonary function instrument. The heart rate (HR), systolic blood pressure (SBP), diastolic blood pressure (DBP), augmentation index (AIx), carotid femoral pulse wave velocity (cf-PWV) and other cardiovascular function indexes were measured by German vicorder cardiovascular detector. The data can be used to evaluate the cardiopulmonary system function of natives in Tibet, and further analyze the effects of ozone exposure and hypoxia on the cardiopulmonary system function of high altitude natives.
GONG Jicheng
")
1) The data content includes three stages of soil erosion intensity in Qinghai-Tibet Plateau in 1992, 2005 and 2015m the grid resolution is 300m.2) The data of soil erosion intensity are obtained by using the Chinese soil erosion prediction model (CSLE). The formula of soil erosion prediction model includes rainfall erosivity factor, soil erodibility factor, slope length factor, slope factor, vegetation cover and biological measure factor, engineering measure factor and tillage measure factor. Rainfall erodibility factors are calculated from the daily rainfall data by the US Climate Prdiction Center (CPC); soil erodibility factors, engineering measures factors and tillage measures factors are obtained from the first water conservancy census data; slope length factors and slope factors are obtained by resampling after calculating 30 m elevation data; vegetation coverage and biological measures factors are obtained by combining fractional vegetation cover with land use data and rainfall erodibility proportionometer. The fractional vegetation cover is calculated by MODIS vegetation index products through pixel dichotomy. 3) Compared with the data of soil erosion intensity in the same region in the same year, there is no significant difference and the data quality is good.4) the data of soil erosion intensity is of great significance for studying the present situation of soil erosion in Pan third polar 65 countries and better carrying out the development policy of the area along the way.
ZHANG Wenbo
")
The Slope Length and Stepness Factor (LS) dataset of Pan-third pole 20 country is calculated based on the free accessed 1 arc second resolution SRTM digital elevation data (Shuttle Radar Topography Mission, SRTM; the website is http://srtm.csi.cgiar.org). After the pre-processing such as pseudo edge removal, filtering and noise removal, the LS factor with 7.5 arc second resolution was calculated with the LS factor algorithm in CSLE model and the LS calculation tool (LS_tool) developed in this project. The LS factor data of Pan-third pole 20 countries is the fundamental data for soil erosion rate calculation based on CSLE, and it also the fuandatmental data for analyzing the erosion topographic characteristics of Pan third pole 20 countries (such as macro distribution and micro pattern of elevation, slope and slope) . The dataset if of great importance for the analysis of geomorphic characteristics and geological disaster characteristics in this area.
YANG Qinke
")
As the roof of the world, the water tower of Asia and the third pole of the world, the Qinghai Tibet Plateau is an important ecological security barrier for China and even Asia. With the rapid development of social economy, human activities have increased significantly, and the impact on the ecological environment is growing. In this paper, eight factors including cultivated land, construction land, National Road, provincial road, railway, expressway, GDP and population density were selected as the threat factors, and the attributes of the threat factors were determined based on the expert scoring method to evaluate the habitat quality of the Qinghai Tibet Plateau, so as to obtain six data sets of the habitat quality of the agricultural and pastoral areas of the Qinghai Tibet Plateau in 1990, 1995, 2000, 2005, 2010 and 2015. The production of habitat quality data sets will help to explore the habitat quality of the Qinghai Tibet Plateau and provide effective support for the government to formulate sustainable development policies of the Qinghai Tibet Plateau.
LIU Shiliang, LIU Yixuan, SUN Yongxiu, LI Mingqi

Topographic relief is a comprehensive representation of regional altitude and surface cutting degree. Based on the definition and calculation formula of topographic relief under the background of China's human settlements assessment, the digital elevation model (Aster GDEM 30 m) data is resampled into 1 km, The data set includes: (1) kilometer grid spatial data of Tibetan Plateau topographic relief( 2) Terrain suitability evaluation data of Qinghai Tibet Plateau. The data can be used to analyze the spatial difference of topographic relief of the Qinghai Tibet Plateau, which is of great significance to the study of human settlements and Natural Suitability of the Qinghai Tibet Plateau.
XIAO Chiwei, LI Peng,

The data set is from Gaomeigu area in Lijiang, Yunnan Province. The longitude, latitude and altitude of Gaomeigu area are 100 E ° 01 ′ 51 ″, 26 n ° 42 ′ 32 ″, altitude 3200m. The data set includes: 1. Continuous observation of the mass concentration of fusible chemical components in the atmosphere, including organic matter, nitrate, sulfate, chloride and ammonia. The measurement instrument is the aerosol chemical composition on-line monitor (ACSM). The observation period is from 00:29 on March 13, 2018 to 01:27 on April 7, 2018, and the time resolution is 30 minutes. The intermediate instrument runs well, and the data is missing occasionally. The data file contains the mass concentration data of each component measured by the instrument. 2. Continuously observe the mass concentration of black carbon in the atmosphere. The measuring instrument is aethalometer ae33 black carbon instrument produced by Magee company. The observation period is from 00:00 on March 14, 2018 to 23:59 on May 13, 2018, and the time resolution is 1 minute. The whole observation instrument works well, and the data is missing occasionally. The data file contains the information of the instrument, the measured mass concentration data of black carbon and various parameters of the instrument, including temperature, pressure, flow rate, etc. 3. Continuously observe the mass concentration of nitric oxide and nitrogen oxides in the atmosphere. The measuring instrument is the NOx analyzer produced by Thermo Fisher company. The observation period is from 00:00 on April 10, 2018 to 23:59 on May 13, 2018, and the time resolution is 1 minute. The whole observation instrument works well, and the data is missing occasionally. The data file contains the mass concentration data of NOx and no gas measured by the instrument. 4. Continuously observe the mass concentration of ozone in the atmosphere. The measuring instrument is the 49i ozone analyzer produced by Thermo Fisher company. The observation period is from 00:00 on March 15, 2018 to 23:59 on May 13, 2018, and the time resolution is 1 minute. The whole observation instrument works well, and the data is missing occasionally. The data file contains the mass concentration data of ozone gas measured by the instrument. 5. Continuously observe the mass concentration of sulfur dioxide in the atmosphere. The measuring instrument is sulfur dioxide analyzer produced by Thermo Fisher company. The observation period is from 00:00 on March 15, 2018 to 23:59 on May 13, 2018, and the time resolution is 1 minute. The whole observation instrument works well, and the data is missing occasionally. The data file contains the mass concentration data of sulfur dioxide gas measured by the instrument. Supported project: the second comprehensive scientific expedition to the Qinghai Tibet Plateau 2019qzk0602.
WANG Qiyuan, ZHANG Ningning, ZHU Chongshu, HU Tafeng, WU Feng, DAI Wenting, RAN Weikang

As the “third pole” of the world, the Qinghai-Tibet Plateau (QTP) is extremely ecologically sensitive and fragile while facing increasing human activities and overgrazing. In this study, eight types of spatial data were firstly selected, including grazing intensity, Night-Time Light, population density, Gross Domestic Product (GDP) density, the ratio of cultivated land, the slope of the Normalized Difference Vegetation Index (NDVI), distance to road, and distance to town. Then, the entropy weight method was applied to determine the weight of each factor. Finally, the five-year interval human activity intensity data in 1990, 1995, 2000, 2005, 2010 and 2015 were made in the agricultural and pastoral areas of QTP through the spatial overlap method. By preparing the historical spatial datasets of human activity intensity, our study will help to explore the influence of human disturbance on the alpine ecosystems on the QTP and provide effective support for decision-making of government aiming at regional ecosystem management and sustainable development.
LIU Shiliang, SUN Yongxiu, LIU Yixuan, LI Mingqi
")
Referring to the temperature-humidity index formula proposed by J.E. Oliver in 1973, the temperature-humidity index of thethe Green Silk Road Countries(GSRCs) is calculated based on the annual average temperature and relative humidity. The climate suitability assessment of human settlements of the GSRCs is carried out on the basis of the temperature-humidity index. the climate suitability of human settlements in different areas of GSRCs can be divided into five categories: Non-suitable area,Critically suitable area, Low suitable area, Moderately suitable area and High suitable area, based on the distribution characteristics of temperature-humidity index and its correlation with population distribution, according to the regional characteristics and differences of temperature and relative humidity, and referring to the physiological climate evaluation standard of temperature-humidity index.
LIN Yumei

This dataset subsumes sustainable livestock carrying capacity in 2000, 2010, and 2018 and overgrazing rate in 1980, 1990, 2000, 2010, and 2017 at county level over Qinghai Tibet Plateau. Based on the NPP data simulated by VIP (vehicle interface process), an eco hydrological model with independent intellectual property of the institute of geographic sciences and nature resources research(IGSNRR), Chinese academy of Sciences(CAS), the grass yield data (1km resolution) is obtained. Grass yield is then calculated at county level, and corresponding sustainable livestock carring capacity is calculated according to the sustainable livestock capacity calculation standard of China(NY / T 635-2015). Overgrazing rate is calculated based on actual livestock carring capacity at county level.The dataset will provide reference for grassland restoration, management and utilization strategies.
MO Xingguo
")
1) The data includes the soil erosion modulus of 11 watersheds with a resolution of 5 m in the year of 2017 in Tibet. 2)Based on the surface layer of rainfall erosivity R, soil erodibility K, slope length factor LS, vegetation coverage FVC, and rotation sampling survey unit, the Chinese soil erosion model (CSLE) was used to calculate soil erosin modulus in 11 watersheds respectively. Through spatial data processing (including chart linking and transformation, vector-grid conversion, and resampling), R, K, LS factors were calculated from the regional thematic map of rainfall erosivity, soil erodibility, and DEM. By half-month FVC, NPV, half-month rainfall erosivity data, we calculated the value of B factors in each sampling watershed. The value of E factor was calculated based on the remote sensing interpretation results and engineering measure factor table. The value of tillage factor T was obtained from tillage zoning map and tillage measure table. And then the soil erosion modulus in each sampling watershed was calculated by the equation: A=R•K•LS•B•E•T. The selection of 11 watersheds was based on the layout of sampling survey in pan-third polar region. 3) Compared with the data of soil erosion intensity in the same region in the same year, there is no significant difference and the data quality is good.4) the data of soil erosion modulus is of great significance for studying the present situation of soil erosion in Pan third polar region, and it is also crucial for the implementation of the development policy of the Silk Road Economic Belt and the 21st-Century Maritime Silk Road.
")
1) Establish the material flow analysis table and air pollutant emission table of Xining Special Steel Co., Ltd. (Xining Special Steel) in 2019 ,to provide support for the analysis and distribution of pollutant emission sources of regional iron and steel industry. 2) The data comes from the official website of Xining Special Steel, field survey and statistical data. Based on the official data and field survey results, some results are calculated by the relevant industry parameters 3) Due to the different sources of ore raw materials, the calculation is only for the steel production process in 2019 4) Xining Special Steel is a typical enterprise in the iron and steel industry of Qinghai Province. Its crude steel production is more than 90% of that of Qinghai Province. Therefore, the data represent the material flow characteristics of the iron and steel industry in Qinghai Province
LI Xiaojun
")
The data set records the statistical data of added value and growth rate of different industries in Qinghai Province from 2014 to 2018, and the data is divided by year. The data are collected from the statistical yearbook of Qinghai Province issued by the Bureau of statistics of Qinghai Province. The data set contains two data tables, which are: value added and growth rate by industry 2014-2017.xls, value added and growth rate by industry 2015-2018.xls. The data table structure is the same. For example, the data table from 2014 to 2017 has five fields: Field 1: Industry Field 2: 2014 Field 3: 2015 Field 4: 2016 Field 5: 2017
Qinghai Provincial Bureau of Statistics
")
This data set records some monitoring data of Gonghe sewage treatment plant in Hainan Province from 2013 to 2019. The data is collected from the Department of ecological environment of Qinghai Province. The data set contains six data files, which are: the monitoring results of Gonghe sewage treatment plant in Hainan prefecture of Qinghai Province in the fourth quarter of 2014, the monitoring data audit of Gonghe sewage treatment plant in Hainan prefecture of Qinghai Province in the fourth quarter of 2015, the monitoring data audit of Gonghe sewage treatment plant in Hainan prefecture of Qinghai Province in the first quarter of 2016 Online comparative monitoring [2013] No. 023-4-3 of Hexian wastewater treatment plant, the first half of 2019 of Gonghe wastewater treatment plant in Hainan Province, and the second half of 2019 of Gonghe wastewater treatment plant in Hainan Province. There are 15 fields in the monitoring result table of sewage treatment plant Field 1: Administrative Region Field 2: name of sewage treatment plant Field 3: receiving water body Field 4: monitoring date Field 5: name of executive standard Field 6: name of execution standard condition Field 7: Design daily capacity (T / D) Field 8: import flow (T / D) Field 9: export flow (T / D) Field 10: monitoring items Field 11: inlet concentration (mg / L) Field 12: outlet concentration (mg / L) Field 13: standard limit (mg / L) Field 14: emission unit Field 15: is it up to standard Waste gas monitoring data audit table, a total of 16 fields Field 1: Administrative Region Field 2: enterprise name Field 3: industry name Field 4: monitoring point name Field 5: name of executive standard Field 6: monitoring date Field 7: operating load (%) Field 8: flow (m3 / h) Field 9: flue gas temperature (℃) Oxygen content: 10% Field 11: monitoring item name Field 12: measured concentration (mg / m3) Field 13: standard limit (mg / m3) Field 14: emission unit Field 15: is it up to standard Field 16: excess multiple
Department of Ecology and Environment of Qinghai Province
")
The data set records the generation of hazardous waste in Haixi Prefecture of Qinghai Province, the standardized management indicators of business units and the list of spot check and assessment. The data were collected from the Department of ecological environment of Haixi Prefecture. The data set includes two data tables, which are: the standardized management index and spot check list of hazardous waste generating units in Haixi Prefecture in 2019, and the standardized management index and spot check list of hazardous waste operating units in Haixi Prefecture in 2019. The data table structure is the same. Each data table has six fields as follows: Field 1: serial number Field 2: company name Field 3: Score Field 4: Comprehensive Evaluation Field 5: Region Field 6: Backup
Ecological Environment Bureau of Haixi Prefecture Qinghai Province
")
The data set records the monitoring report of the key industrial enterprises in Qinghai Province (2015-2020). The data is collected from the Department of ecological environment of Qinghai Province. The data set contains 115 data files, including the supervision monitoring of Qinghai Huadian Datong Power Generation Co., Ltd. in the first quarter of 2015, the supervision monitoring of Qinghai Huadian Datong Power Generation Co., Ltd. in the second quarter of 2015, the supervision monitoring of Qinghai Huadian Datong Power Generation Co., Ltd. in the third quarter of 2015, and the supervision monitoring of Qinghai Huadian Datong Power Generation Co., Ltd. in the fourth quarter of 2015 Supervision monitoring of Huadian Datong Power Generation Co., Ltd. The key polluting enterprises involved are: Qinghai Huadian Datong Power Generation Co., Ltd., Qinghai Products Industry Investment Co., Ltd., Qilian mountain cement, Qinghai ningbei Power Generation Co., Ltd., Qinghai Qiaotou Aluminum Power Co., Ltd., Qinghai new building materials industry and Trade Co., Ltd., Qinghai Products Industry Investment Co., Ltd., Qinghai Yihua Chemical Co., Ltd., and Chalco Qinghai Branch Company, Qinghai cement, Baihe aluminum, Huaneng Xining Thermal Power Co., Ltd., Huanghe Xinye, Jihua Jiangyuan, Qinghai Huanghe Jianiang Beer Co., Ltd., Qinghai Jiangcang Energy Development Co., Ltd., Qinghai ningbei Power Generation Co., Ltd., Qinghai Tianlu Dairy Co., Ltd., Qinghai xiaoxiniu Dairy Co., Ltd., Western zinc and Xining Special Steel Co., Ltd Company, Asia silicon (Qinghai) Co., Ltd., Salt Lake Haina, yuntianhuazhong, State Power Investment Group Xi'an solar power generation Co., Ltd., upper Yellow River Hydropower Development Co., Ltd., Qinghai Electronic Materials Industry Development Co., Ltd., Qinghai Yellow River Jianiang Beer Co., Ltd., Qinghai Pharmaceutical Factory Co., Ltd., Qinghai Western Indium Industry Co., Ltd., Qinghai Hongyang Cement Co., Ltd Ltd., Qinghai Jieshen Environmental Energy Industry Co., Ltd., etc. among Monitoring point: flue gas outlet of rotary kiln. Monitoring items: particulate matter, sulfur dioxide, nitrogen oxides, flue gas flow. Monitoring frequency: three samples per production cycle under normal operation condition Contents of daily monitoring: cod, pH, COD, cod
Department of Ecology and Environment of Qinghai Province
")
This data set records some monitoring data of Hainan sewage treatment plant in Qinghai Province from 2015 to 2018. The data is collected from the ecological environment bureau of Hainan prefecture, and the data set contains six data tables, which are: the monitoring data audit of Hainan sewage treatment plant in Qinghai Province in the second quarter of 2015, the monitoring data audit of Hainan sewage treatment plant in Qinghai Province in the third quarter of 2015, the monitoring data audit of Hainan sewage treatment plant in Qinghai Province in the first quarter of 2015, and the monitoring data audit of Hainan sewage treatment plant in Qinghai Province In the fourth quarter of 2017, the monitoring data of Hainan sewage treatment plant in Qinghai Province - the fourth quarter of 2018, and the monitoring data of Hainan sewage treatment plant in Qinghai Province - the first quarter of 2018, the data table structure is the same. Sewage treatment plant monitoring data audit table: a total of 15 fields Field 1: Administrative Region Field 2: name of sewage treatment plant Field 3: receiving water body Field 4: monitoring date Field 5: name of executive standard Field 6: name of execution standard condition Field 7: Design daily capacity (T / D) Field 8: import flow (T / D) Field 9: export flow (T / D) Field 10: monitoring items Field 11: inlet concentration (mg / L) Field 12: outlet concentration (mg / L) Field 13: standard limit (mg / L) Field 14: emission unit Field 15: is it up to standard
Ecological Environment Bureau of Hainan Prefecture
")
The data set records the monitoring results of Haixi sewage treatment plant in Qinghai Province from 2013 to 2016. The data is collected from the Department of ecological environment of Qinghai Province. The data set includes 8 data tables, 3 PDF files and 5 compressed documents, which are respectively the supervision monitoring results of Haixi sewage treatment plant in Qinghai Province in the second quarter of 2015, the supervision monitoring results of Haixi sewage treatment plant in Qinghai Province in the third quarter of 2015 and the supervision monitoring results of Haixi sewage treatment plant in Qinghai Province in the fourth quarter of 2015 In the fourth quarter of 2016, the supervision monitoring results of Haixi sewage treatment plant in Qinghai Province, the supervision monitoring results of Haixi sewage treatment plant in the first quarter of 2016, the supervision monitoring data of Dulan sewage treatment plant in the second quarter of 2017, the supervision monitoring results of Golmud sewage treatment plant in the second quarter of 2017, and the supervision monitoring results of Wulan sewage treatment plant in the second quarter of 2017 The monitoring results of Haixi sewage treatment plant in Qinghai Province in the fourth quarter of 2013, the second quarter of 2014 and the third quarter of 2014. The data table contains 10 fields: Field 1: Administrative Region Field 2: name of sewage treatment plant Field 3: monitoring date Field 4: name of executive standard Field 5: monitoring items Field 6: outlet concentration (mg / L) Field 7: standard limit (mg / L) Field 8: emission unit Field 9: evaluation conclusion Field 10: excess multiple
Department of Ecology and Environment of Qinghai Province
")
The data set records the monitoring reports of key pollution sources in Hainan Province from 2013 to 2014. The data is collected from the Department of ecological environment of Qinghai Province, and the data set contains two data files, which are: Supervision Monitoring Report of key pollution sources controlled by Hainan Province in Qinghai Province - 2013, and supervision monitoring report of key pollution sources controlled by Hainan Province in Qinghai Province - 2014. The monitoring sites cover six enterprises including Qinghai Xuefeng yak Dairy Co., Ltd. and Hainan Sifang Thermal Power Co., Ltd. the monitoring items are: smoke and dust, sulfur dioxide, nitrogen oxide export emission concentration and emission, pH, ammonia nitrogen, BOD5, total phosphorus, total nitrogen, nitrate nitrogen, suspended solids, chemical oxygen demand; the monitoring frequency is one day, four times in a row; the monitoring frequency is one day, four times in a row;
Ecological Environment Bureau of Hainan Prefecture
")
This data set records the supervisory monitoring data of state-controlled waste gas and wastewater enterprises in Haixi Prefecture of Qinghai Province from 2013 to 2018. The data is collected from the Department of ecological environment of Qinghai Province. The data set contains 46 worksheets and 19 compressed files, which are respectively the results of the supervision monitoring of the state-controlled waste gas enterprises in Haixi Prefecture of Qinghai Province in the fourth quarter of 2013, and the results of the supervision monitoring of the state-controlled waste water enterprises in Haixi Prefecture of Qinghai Province in the fourth quarter of 2013. Waste gas monitoring data audit table, a total of 16 fields Field 1: Administrative Region Field 2: enterprise name Field 3: industry name Field 4: monitoring point name Field 5: name of executive standard Field 6: monitoring date Field 7: operating load (%) Field 8: flow (m3 / h) Field 9: flue gas temperature (℃) Oxygen content: 10% Field 11: monitoring item name Field 12: measured concentration (mg / m3) Field 13: standard limit (mg / m3) Field 14: emission unit Field 15: is it up to standard Field 16: excess multiple The number of wastewater supervision monitoring, including 16 fields Field 1: Administrative Region Field 2: industry name Field 3: receiving water body Field 4: monitoring point name Field 5: name of executive standard Field 6: name of execution standard condition Field 7: monitoring date Field 8: production load (%) Field 9: monitoring point flow (T / D) Field 10: monitoring item name Field 11: pollutant concentration Field 12: standard limits Field 13: Unit Field 14: is it up to standard Field 15: excess multiple Field 16: enterprise name
Department of Ecology and Environment of Qinghai Province

Geographical distribution of major ecological protection and construction projects on the Tibetan plateau. There are four main projects, i.e. forest protection and construction project, grassland protection and construction project, desertification control project, soil erosion comprehensive control project. Processing method: classified summary, and the county as a unit of the regional distribution.
Da Wei
")
The data set records the carbon dioxide emissions of 1960-2014 countries along 65 countries along the belt and road.Carbon dioxide emissions are those stemming from the burning of fossil fuels and the manufacture of cement. They include carbon dioxide produced during consumption of solid, liquid, and gas fuels and gas flaring.Data source:Carbon Dioxide Information Analysis Center, Environmental Sciences Division, Oak Ridge National Laboratory, Tennessee, United States.The U.S. Department of Energy's Carbon Dioxide Information Analysis Center (CDIAC) calculates annual anthropogenic emissions from data on fossil fuel consumption (from the United Nations Statistics Division's World Energy Data Set) and world cement manufacturing (from the U.S. Department of Interior's Geological Survey, USGS 2011). The dataset contains 2 tables: CO2 emissions(kt),CO2 emissions(metric tons per capita).
XU Xinliang, Department of Energy Carbon Dioxide Information Analysis Center (CDIAC)
")
The data set recorded one belt, one road, 2002-2016 years' fertilizer and pesticide consumption data in 65 countries. Fertilizer and pesticide consumption refers to the amount of plant nutrients and pesticides consumed per unit of cultivated land. Fertilizer products include nitrogen, potassium and phosphate (including phosphate rock powder), and traditional nutrients animal and plant fertilizers are not included. Data source: Food and Agriculture Organization, electronic files and web site. Fertilizer and pesticide are the main sources of agricultural chemical pollution, which pose a serious threat to the agricultural ecological environment and the sustainable development of agricultural economy. The data set reflects one belt, one road, along the line of fertilizer and pesticide use, and can provide data support for the research on agricultural ecological environment and other related research. The data set contains two data tables: fertilizer consumption (kg / ha of cultivated land) and pesticide consumption (kg / ha of cultivated land).
XU Xinliang
")
The data set of socio-economic vulnerability parameters in the agricultural and pastoral areas of the Qinghai Tibet Plateau mainly contains the socio-economic vulnerability parameter data at county level. The data time range is from 2000 to 2015, involving 112 counties and districts in Qinghai Province and Tibet Autonomous Region. The main parameters include population density, the proportion of unit employees in the total population, the proportion of rural employees in the total population, the proportion of agricultural, forestry, animal husbandry and fishery employees in rural employees, per capita GDP, per capita savings balance of residents, per capita cultivated land area, per capita grain output, and people Average oil production, livestock stock per unit area, per capita meat production, the proportion of primary and secondary school students in the total population, and the number of hospital beds per 10000 people. The entropy weight method is used to calculate the weight of each index, and ArcGIS is used to spatialize, and finally the county scale socio-economic vulnerability parameter data is obtained. The original data is from the statistical yearbook of Qinghai Province and Tibet Autonomous Region. The data are expressed by shape file and excel file. This data set will provide reference for socio-economic vulnerability assessment and selection of typical agricultural and pastoral areas.
ZHAN Jinyan, TENG Yanmin, LIU Shiliang
")
The data set records the monitoring data statistics of Huangnan wastewater treatment plant in Qinghai Province from 2017 to 2018. The data is from the Department of ecological environment of Qinghai Province. The data set contains 11 data tables, which are: the audit table of monitoring data of Huangnan sewage treatment plant in the second quarter of 2017, the audit of monitoring data of Huangnan sewage treatment plant in the third quarter of 2017, the audit of waste water monitoring data of Huangnan state-controlled enterprises in the fourth quarter of 2017, the audit of waste gas monitoring data of Huangnan state-controlled enterprises in the first quarter of 2017, and the audit of Huangnan sewage treatment plant in the first quarter of 2017 Audit of monitoring data of plant management, audit of monitoring data of sewage treatment plant in November 2017, audit of monitoring data of waste water from pollution sources of provincial controlled enterprises in the third quarter of 2017, audit of monitoring data of waste water in the first quarter of 2018, audit of monitoring data of waste gas in the second quarter of 2018, audit of monitoring data of sewage treatment plant in the second quarter of 2018 and audit of monitoring data of waste water in the third quarter of 2018 Water treatment plant monitoring data audit, Huangnan state-controlled enterprise waste gas monitoring data audit in the fourth quarter of 2018, Huangnan sewage treatment plant monitoring data audit in the fourth quarter of 2018. The data table structure is different. Sewage treatment plant monitoring data audit table: a total of 15 fields Field 1: Administrative Region Field 2: name of sewage treatment plant Field 3: receiving water body Field 4: monitoring date Field 5: name of executive standard Field 6: name of execution standard condition Field 7: Design daily capacity (T / D) Field 8: import flow (T / D) Field 9: export flow (T / D) Field 10: monitoring items Field 11: inlet concentration (mg / L) Field 12: outlet concentration (mg / L) Field 13: standard limit (mg / L) Field 14: emission unit Field 15: is it up to standard Waste gas monitoring data audit table, a total of 16 fields Field 1: Administrative Region Field 2: enterprise name Field 3: industry name Field 4: monitoring point name Field 5: name of executive standard Field 6: monitoring date Field 7: operating load (%) Field 8: flow (m3 / h) Field 9: flue gas temperature (℃) Oxygen content: 10% Field 11: monitoring item name Field 12: measured concentration (mg / m3) Field 13: standard limit (mg / m3) Field 14: emission unit Field 15: is it up to standard Field 16: excess multiple
Department of Ecology and Environment of Qinghai Province
")
The data set records the typical geological disasters in Qinghai Province from 1999 to 2017. The data are collected from the Department of ecological environment of Qinghai Province, and the data set includes seven tables: the content of hexavalent chromium in spring 1 of Xinghuo village, Haiyan County, 1999-2011, the content of hexavalent chromium in spring 1 of Xinghuo village, Haiyan County, Qinghai Province, 1999-2012, the content of hexavalent chromium in spring 1 of Xinghuo village, Haiyan County, Qinghai Province, 2002-2013, the content of hexavalent chromium in spring 1 of Xinghuo village, Haiyan County, Qinghai Province, 2002-2014, and 2006-2015 The structure of the data sheet is the same as the table of hexavalent chromium content in spring 1, Xinghuo village, Haiyan County, Qinghai Province in 2006-2016, and the table of hexavalent chromium content in spring 1, Xinghuo village, Haiyan County, Qinghai Province in 2006-2017. Each data table has two fields, Field 1: year Field 2: content
Department of Ecology and Environment of Qinghai Province
")
The data content includes the spatial distribution map of the impact of agricultural development on the ecological environment in 1985, 1993, 2000, 2005, 2010 and 2015. This data set takes the impact of agricultural development on ecological environment as the evaluation objective, establishes the ecological environment evaluation index system composed of 14 indexes of 3 types of elements by using the pressure state response model, obtains the weight of each index by using the entropy weight method, and finally analyzes the correlation between each index and the corresponding evaluation level by using the matter-element analysis method to build the Qinghai Tibet Plateau base The entropy weight extension ecological environment evaluation model of pressure state response reveals the impact of agricultural activities on the ecological environment.
LI Dan
")
1) The dataset includes the raster data of soil erosion intensity in Pan-Third Pole 65 countries.2) The data of soil erosion intensity are obtained by using the Chinese soil loss equation (CSLE). The formula of soil erosion prediction model includes rainfall erosivity factor, soil erodibility factor, slope length factor, slope factor, vegetation cover and biological measure factor, engineering measure factor and tillage measure factor. Rainfall erodibility factors are calculated from the daily rainfall data by the US Climate Prdiction Center (CPC); soil erodibility factors are calculated by 250 m soil grid data; engineering measure factors are calculated based on vegetation cover, land use and rainfall erosivity ratio; tillage measure factors haven't been considered yet, and the default value is 1; slope length factors and slope factors are obtained by resampling after calculating 30 m elevation data; vegetation coverage and biological measures factors are obtained by combining fractional vegetation cover with land use data and rainfall erodibility proportionometer. The fractional vegetation cover is calculated by MODIS vegetation index products through pixel dichotomy. 3) Compared with the data of soil erosion intensity in the same region in the same year, there is no significant difference and the data quality is good.4) the data of soil erosion intensity is of great significance for studying the present situation of soil erosion in Pan third polar 65 countries and better implementation of the development policy of the Silk Road Economic Belt and the 21st-Century Maritime Silk Road.
ZHANG Wenbo

The interaction mechanism project between major road projects and the environment in western mountainous areas belongs to the major research plan of "Environment and Ecological Science in Western China" of the National Natural Science Foundation. The person in charge is Cui Peng researcher of Chengdu Mountain Disaster and Environment Research Institute, Ministry of Water Resources, Chinese Academy of Sciences. The project runs from January 2003 to December 2005. Data collected for this project: Engineering and Environmental Centrifugal Model Test Data (word Document): Consists of six groups of centrifugal model test data, namely: Test 1. Centrifugal Model Test of Soil Cutting High Slope (6 Groups) Test 2. Centrifugal Model Experiment of Backpressure for Slope Cutting and Filling (4 Groups) Test 3. Centrifugal Model Experimental Study on Anti-slide Piles and Pile-slab Walls (10 Groups) Test 4. Centrifugal Model Tests for Different Construction Timing of Slope (5 Groups) Test 5. Migration Effect Centrifugal Model Test (11 Groups) Test 6. Centrifugal Model Test of Water Effect on Temporary Slope (8 Groups) The purpose, theoretical basis, test design, test results and other information of each test are introduced in detail.
CUI Peng
")
This data includes the accessibility of 15 kinds of public facilities and services, such as roads and schools, in the communities of 1280 households at domestic and abroad, as well as the farmers' satisfaction with these public facilities and public services by comparing that with 3 years ago and current status with neighboring village. This data is used to support the analysis of the material capital part of sustainable livelihood. The primary data collected by the research group in household survey. Before collecting the data, the research group and invited experts conducted a preliminary survey and improved the survey questionnaire; Before the formal investigation, the personnel participating in the data collection were strictly trained; In the formal survey, each questionnaire is checked three times before it is filed. 4. This data is of great value for understanding the physical capital accessibility and satisfaction of rural households in environment-economic fragile areas, and is an important supplement to national and macro data.
Linxiu ZHANG, BAI Yunli
This data includes the accessibility of 15 kinds of public facilities and services, such as roads and schools, in the communities of 1280 households at domestic and abroad, as well as the farmers' satisfaction with these public facilities and public services by comparing that with 3 years ago and current status with neighboring village. This data is used to support the analysis of the material capital part of sustainable livelihood. The data was collected by the research group through field survey in 2019. Before collecting the data, the research group and invited experts conducted a pretest and improved the survey questionnaire; Before the formal investigation, the members participating in the data collection were strictly trained; In the formal survey, each questionnaire is checked three times before it is filed. This data is of great value for understanding the physical capital accessibility and satisfaction of rural households in environment-economic fragile areas, and is an important supplement to national and macro data.
Linxiu ZHANG, BAI Yunli
")
The data set records the monitoring data of hexavalent chromium content in zhangshengcaijiajing, shangbaobao village, Changning Town, Datong County, Qinghai Province from 2002 to 2015. The data is from the official website of the Department of ecological environment of Qinghai Province. The data set contains five data tables, which are: hexavalent chromium content of zhangshengcaijiajing in shangbaobao village, Changning Town, Datong County from 2002 to 2011, hexavalent chromium content of zhangshengcaijiajing in shangbaobao village, Changning Town, Datong County from 2002 to 2012, hexavalent chromium content of zhangshengcaijiajing in shangbaobao village, Changning Town, Datong County from 2002 to 2013, hexavalent chromium content of zhangshengcaijiajing in shangbaobao village, Changning Town, Datong County from 2002 to 2014, and hexavalent chromium content of zhangshengcaijiajing in Datong County from 2002 to 2015 The structure of the data sheet is the same. Each data table has two fields: Field 1: year Field 2: content (mg / L)
Department of Ecology and Environment of Qinghai Province
")
The data set records the supervisory monitoring report of Xining Power Generation Branch of the upper Yellow River Hydropower Development Co., Ltd., covering the period from 2017 to 2018. The data is collected from the Department of ecological environment of Qinghai Province, and the data set contains four PDF files, which are: supervision monitoring of Xining Power Generation Branch of upper Yellow River Hydropower Development Co., Ltd. in the first half of 2017, supervision monitoring of Xining Power Generation Branch of upper Yellow River Hydropower Development Co., Ltd. in the second half of 2017, and supervision monitoring of Xining Power Generation Branch of upper Yellow River Hydropower Development Co., Ltd. in 2018 Supervision monitoring in the first half of the year, and supervision monitoring in the second half of 2018 of Xining Power Generation Branch of upper Yellow River Hydropower Development Co., Ltd. The basic information of monitoring points, monitoring methods, and monitoring data of Qinghai Province are released by Qinghai provincial monitoring center.
Department of Ecology and Environment of Qinghai Province

According to the characteristics of the Qinghai Tibet Plateau and the principles of scientificity, systematization, integrity, operability, measurability, conciseness and independence, the human activity intensity evaluation index system suitable for the Qinghai Tibet Plateau has been constructed, which mainly includes the main human activities such as agricultural and animal husbandry activities, industrial and mining development, urbanization development, tourism activities, major ecological engineering construction, pollutant discharge, etc, On the basis of remote sensing data, ground observation data, meteorological data and social statistical yearbook data, the positive and negative effects of human activities are quantitatively evaluated by AHP, and the intensity and change characteristics of human activities are comprehensively evaluated. The data can not only help to enhance the understanding of the role of human activities in the vegetation change in the sensitive areas of global change, but also provide theoretical basis for the sustainable development of social economy in the Qinghai Tibet Plateau, and provide scientific basis for protecting the ecological environment of the plateau and building a national ecological security barrier.
ZHANG Haiyan, XIN Liangjie, FAN Jiangwen, YUAN Xiu
")
The data set records the statistical data of urban sewage treatment in Qinghai Province from 2002 to 2013, which is divided by industry, region and purpose. The data are collected from the statistical yearbook of Qinghai Province issued by the Bureau of statistics of Qinghai Province. The data set contains 10 tables, which are: urban sewage treatment 2002-2003.xls, urban sewage treatment 2003-2005.xls, urban sewage treatment 2003-2006.xls, urban sewage treatment 2003-2007.xls, urban sewage treatment 2004-2008.xls, etc. The data table structure is the same. For example, there are three fields in the data table from 2002 to 2003 Field 1: year Field 2: Indicators Field 3: other
Qinghai Provincial Bureau of Statistics
Contact Support
Links
National Tibetan Plateau Data CenterFollow Us

A Big Earth Data Platform for Three Poles © 2018-2020 No.05000491 | All Rights Reserved
|  No.11010502040845
Tech Support: westdc.cn